|
Web Reader on Membrane Biophysics - Part I Table of contents I Thermodynamics
and solution behavior of macromolecules
Thermodynamics and solution behavior of macromolecules 1. Energy of biological systems (van Holde, 2nd ed., chapter 2, p.72) Thermodynamics is concerned with changes in equilibrium processes and determines the direction a process is taking, but not its kinetics, i.e., how long it takes for the process to finish. Thermodynamics is concerned with the physical parameters describing a system's macroscopic properties like temperature, pressure, concentration, and volume. It is important to always keep the distinction between macroscopic and microscopic properties in mind. In addition to thermodynamic properties, we also wish to understand the kinetic behavior of a biological system like the substrate or energy flow rate through a metabolic pathway or the rate constant of a ligand-receptor interaction, i.e., a binding event. Kinetic studies can analyze either macroscopic or microscopic systems depending on the resolution of the experimental measurment. Resolution means the time and amplitude range the measurement takes into consideration. High temporal and spatial resolution spectroscopic techniques have made it possible to study the activity of single molecules and cells. The laws of thermodynamics and kinetics do not tell us directly about
molecular structures or mechanisms, although we can use the results
of thermodynamic measurements - the change in heat, pressure, temperature,
surface tension - and the kinetics of molecular interactions and
reactions to help us interpret molecular mechanisms of a system. But
only the high resolution structure (molecular structure) of proteins
and nucleic acids involved allow the formulation of a detailed molecular
mechanism. The following table compares the relationship between physical
theories and appropriate experimental techniques and if they are useful
for macroscopic or microscopic (structural) analysis of biological systems.
Thermodynamic laws are concerned with the relationship between thermal energy properties of a system and are given as mathematical equations or equations of state (literally meaning an equation describing the relationship between properties of a system). These equations themselves are not derived solely by logical deduction, but represent empirical relationships devised to fit (explain) experimental data. The fundamental question in thermodynamics is the number of parameters
that need to be specified in order to define the state of a system.
This problem has been solved by J.W. Gibbs in 1878 and is known as the
phase rule. For a single pure and homogeneous substance like
liquid water, the phase rule states that one extensive (volume dependent)
property and two intensive (volume independent) properties need to be
known to describe the state of a system. There are no further 'degrees
of freedom' (independent variables) to be adjusted. For each additional
component added to the system, one additional intensive property must
be stated, such as the concentration of a substrate added to a reaction.
A component is defined as a constituent of the system whose concentration
can be independently varied. NaCl is one component, and not two components
because Na+ concentration cannot be independently adjusted from Cl-
concentration.
What is a system? A system is a defined physical entity with boundaries in space and can be considered closed or open, the latter meaning that energy and matter can be exchanged with the environment. The state of a system (matter&energy) can be described thermodynamically only at equilibrium using the parameters listed above. More precisely, thermodynamics describes the changes in energy, work, and matter between two different states of a system, both at equilibrium. Heating up the system, adding more substrate, changing the volume, catalyzing a chemical reaction all change the state of the system and shift its equilibrium.
Changes may be reversible or irreversible. Reversibility is normally achieved when changes occur in very small steps (indicated by the differentials dq and dw etc.) and close to equilibrium. Chemical reactions with a large change in heat (e.g. and explosion) normally are irreversible. In a more general sense, a system undergoes an irreversible process, when the system variables cannot be specified during the process. Metabolic pathways are a mixture of reversible and irreversible reaction steps, with the latter determining the direction of the pathway as a whole. The amount of heat and work exchanged between the system and its surroundings during a reversible process (dq,dw) differ from the amount of heat and work during an irreversible process (dq', dw'). However, the system's total energy at the beginning (state 1) and at the end of the process (state2) are the same for both the reversible and irreversible process. It is only the non-system properties heat and work which depend on the pathway of the process that brings the system from state 1 to state 2. The reason for this? Heat and work are not properties of the system, rather heat and work are forms of energy that pass across the boundary between a system and its surroundings. First law of thermodynamics The first law of thermodynamics defines the conservation of energy. Energy forms of importance to biological systems are the enthalpy, entropy, and chemical potential (the molar free energy). The physical state of a biological system is described by its internal energy (E) which can be measured as translational, vibrational, rotational energy, and chemical energy in covalent and non covalent bonds. The internal energy of a system is a function of the state of the system, but the history, i.e., the exact way of how the current physical state of the system has been obtained, is not important. For changes in internal energy we can write:
We can see that the change in E, or DE, depends on the heat (q) that flows into the system minus the work (w) that the system performs; when heating up water, its volume or pressure will increase (pressure-volume work PV, e.g. expansion)! The convention is that heat absorbed by the system and work done by the system are positive quantities (>0).
For biochemical systems, the internal energy is not easy to measure (all molecular interactions plus translational, vibrational and rotational degrees of freedom) and we define a new property of the system called enthalpy H,which is the internal energy E combined with the PV type of work performed on the system, with P being the external pressure and V the volume of the system. H = E + PV The energy changes of biological systems can be described as
dE = dq - PdV if the only type of work allowed is the change in volume against an external pressure. Experimentally, the heat absorbed by a process at constant volume (PdV = 0) measures DE, while the heat absorbed by a process at constant pressure (VdP = 0) measures DH. The enthalpy of biological systems is measured at constant pressure and equals heat absorbed during a finite change in state.
The experimenter thus can adjust the conditions to either measure the change in enthalpy of a reaction (constant pressure) or the change in internal energy of a system (constant volume). Because biochemical reactions occur in solution (liquid phase) volume changes are normally small and the pressure of the system is usually constant. Enthalpy and internal energy values of biological reactions are approximately the same and are referred to as the energy change of a reaction. What is work? We have seen sofar that heat and work are two forms of energy that can be exchanged between a system and its surroundings. So what is the difference? Both cause changes in the system, but in slightly different ways. Heat changes the temperature of the system, which is a change in the mobility or kinetic energy (a microscopic property) of molecules and atoms. As a result, molecules change their distribution in a random way. Work also changes the mobility and distribution of molecules and atoms, but in a coordinated fashion, i.e., the behavior of many molecules are correlated (expansion, shape change, change in chemical structure and concentrations etc.). Some forms of work defined to describe biological systems are shown in the table below. The intensive variable is a system's property that is independent of the size of the system. The extensive differential refers to the property of the system that undergoes a change during the reaction or process (e.g. expansion work or pressure-volume work the pressure is an intensive property and the volume is an extensive property. Table Some forms of work
The rather different character of heat and work as energy forms has led to the discovery of the reasons behind spontaneity and reversibility in many processes in both the living and non-living world. Spontaneity and reversibility are charecterized by the second law of thermodynamics.
Second law of thermodynamics When a system undergoes a series of processes that return it to its original state, then all properties must assume their original values. We can view this is a cyclic process common to machines, enzymes (catalysts), or cells that produce work in form of mechanical (cell mobility), chemical (energy charge of cell in form of ATP), or electrical work (membrane potential, proton gradient). In a cyclic process, the sum of all steps results in D(Property) = 0. Two noteworthy things happen during this cycle: the work performed and heat absorbed by the system are not zero, because they are not properties of the system. Plus, the system's properties discussed so far do not determine in which direction the cycle runs, i.e., if heat goes in or out of the system, and if the system performs work on the environment or if the surroundings perform work on the system. In order to answer the direction of a process, we will ask two questions. First, what is the difference between heat and work, and second, how can we explain the common experience that conversion of work to heat is not the same as the conversion of heat into work? The direction of the process such as a cyclic reaction is determined by the flow of energy, but this cannot be described in any way by the first law of thermodynamics. The preferred direction of a process is called a spontaneous process (exergonic reaction) and is defined by the tendency of a process to reach chemical equilibrium, where by definition the system does no longer change; the process comes to a stop and the system adopts a state that is obviously preferred over other states. We are all familiar with preferred states and spontaneous processes. Ice melts at room temperature (it absorbs heat) and water never freezes at this condition. A cube of crystalline sugar dissolves in water, but dissolved sugar does not spontaneously crystallize. If we consider "ice in a room at 25°C" or "a sugar cube in a cup of tea" as closed systems, we can now analyze the reasons behind the melting of ice and disolution of sugar:
This can easily be visualized by putting two metal blocks next to each other, each at a different temperature. After some period of time, both metal blocks will have equal temperature because heat flows from the warmer to the cooler block. Assuming that both blocks together form an isolated system, their combined energy remains the same, while the distribution of this energy in form of heat has changed from a more ordered (non-random distribution) to a less ordered state (random distribution). Or in the word of statistical mechanics, from a less probable to a more probable distribution of energy states. To quantify this new property, disorder, which determines the direction of a process, the entropy S has been defined. Entropy is a system's property (unlike heat and work) and is maximal at the equilibrium state of an isolated system. The second law of thermodynamics defines that an isolated system will always tend towards its equilibrium or maximal entropy state. If a spontaneous process leaves the overall system's energy the same (dE = 0), and the entropy of the end state is larger than the entropy of the initial state, the change in entropy dS must be larger than zero (dS > 0 for a spontaneous reaction).
Measuring entropy, i.e., the possible arrangements of the components of a system is experimentally easily achieved by relating the change in entropy to the heat exchange with the surroundings at a particular temperature: dS = dq(rev)/T Since dq under reversible conditions is a measurement for the enthalpy change of the system at constant pressure, the spontaneity of a reaction is given as DH - TDS < 0 (exergonic reaction) The term on the left side is called the change in the Gibbs free energy or DG. Thus a reaction is spontaneous when the change in Gibbs free energy is negative at constant pressure and temperature. These processes are called exergonic, while energy requiring reactions are called endergonic and must be driven by the input of free energy (heat or work). If the Gibbs free energy does not change, DG=0, the system is at chemical or thermodynamic equilibrium. Thus, the spontaneity of a reaction is determined by the three state
properties enthalpy, entropy and temperature of the system. The solubilization
of different salts in aqueous solution can increase or decrease the
temperature of the solution, if the change in entropy (DH)
is large enough to keep the free energy change below zero. Note, however,
that the Gibbs free energy does not describe how fast a reaction occurs.
Very slow reaction kinetics at certain temperatures or pressure ranges
are effectively 'inhibiting' a thermodynamically spontaneous process.
The reaction kinetic depends on the details of the molecular mechanism.
Spontaneity criteria
Thermodynamics of cells Living systems are not at equilibrium, but are at a steady-state equilibrium. Steady-state is defined as a continuous input of energy necessary to make-up for any energy loss or consumption in form of heat, work (motility of cells), or biosynthesis. Life on Earth is an endergonic process driven ultimately by sun light. Metabolism is driven by coupling endergonic with exergonic reactions. The three major sources of energy (exergonic reactions) that provide high energy compounds capable of releasing Gibbs free energy to drive biosynthetic reactions are chemical energy in form of ATP, electrical-chemical energy in form of ion (proton) gradients, and light energy that is used by plants and microorganisms to provide both energy forms of the former type. Fig. Negative entropy changes in living cells Negative entropy is possible in open systems, like organisms, that continuously absorb energy from the environment to build complex structures. Negative entropy is associated with structure formation and as a result, the entropy of the universe (the closed system) must become more positive. ATP + H2O = ADP + Pi ; This is a reversible reaction and proceeds toward the right side, i.e., ATP spontaneously hydrolyzes in aqueous solution resulting in ADP and inorganic phosphate. The formation of ATP on the other hand requires the input of Gibbs free energy, which in cells is achieved by extracting chemical energy from oxidation reactions (oxidative phosphorylation) or capturing of light energy (photosynthesis). Both processes are membrane bound systems and couple an electron transport chain with the formation of proton gradient (electrical work), which in turn can be used to generate ATP from ADP by ingenious molecular machines (converting electrical work into mechanical work into chemical energy) called ATP synthases. During each of the many steps, only a small portion of the available free energy (of glucose, of a photon) is dissipated as heat, because enzyme-catalyzed reactions efficiently capture most of the free energy for the formation of chemical bonds or transport of charges across low dielectric barriers (membranes). Why is the formation of ATP as 'energy currency' biologically useful, despite the fact that it can spontaneously hydrolyze? The latter is very slow compared to the metabolic life time of ATP. Before spontaneously hydrolyzing and producing only heat, ATP hydrolysis is efficiently catalyzed by kinases and ATP synthases channeling the released energy into an endergonic reaction. The 'heat' released from hydrolysis can be used to push the coupled reaction, usually a biosynthetic step (e.g. glucose to glucose-6-phosphate). In the current example, hydrolysis does not result in a 'free' phosphate, but rather the hexokinase (gluckinase) moves the phosphate unit from the ADP carrier to the glucose making glucose-6-phosphate thereby catalyzing a phosphoryl transfer reaction. While this reaction is an example of a strongly exergonic reaction
and is non reversible, many metabolic reactions operate close to chemical
equilibrium. In these cases, the relative concentration of substrates
and products is important and for most metabolic reactions determines
the direction of the process (see chapter on chemical equilibrium for
more details). 2. Molecular interpretation of thermodynamic quantities (chapter 2.2 p.73) The macroscopic parameters of the system's enthalpy changes, DH, are amenable to a molecular interpretation. Energy changes can be explained in terms of the behavior of atoms. This allows to define the main difference between work (w) and heat (q). Work consists of molecular motions across system boundaries in an organized manner or macroscopic scale (PV work, electrical work as charge redistribution), while heat consists in motion on a molecular scale described as the kinetic energy of a molecule. Mathematically, this behavior is quantifiable by statistical thermodynamics. Statistical thermodynamics describes the distribution and frequency of energy states of a system. These energy states at the atomic level change in predictable ways when heating up an aqueous solution, for example. At increased temperature, the atoms (molecules) in the system have an increased kinetic energy, vibrational and rotational energy, but reduced molecular interactions. The question asked by statistical thermodynamics is; how is the energy distributed in the system? The validity of this approach assumes a very large number of molecules which we can assess statistically, but not count individually. The distribution of the energy states is described by the Boltzman distribution. Heat capacity experiments of cooperative processes: a molecular interpretation of DH Biochemical reactions are associated with relatively large changes in enthalpy because of the large bond energies involved. This is certainly true for chemical bonds, but aqueous systems also contain hydrogen bonds which also show considerable energy. The importance of this can be demonstrated by analyzing the details of the mechanism during the melting of ice. The melting of ice occurs at a constant temperature even under constant input of heat. This means that the absorbed heat does not increase the temperature of ice, but causes it to 'melt'. The melting of ice is a cooperative breakage of the hydrogen bond network in the ice crystal. Since all heat absorbed during the melting goes into a coordinated increase in potential energy (potantial energy becomes more positive) of hydrogen bonds, and there are plenty of hydrogen bonds in the crystal lattice, this process displays a large heat capacity at a particular temperature called the melting temperature, much larger than a comparable increase in kinetic energy of the water molecules. This cooperative transition among intermolecular interactions brings water from a crystalline to a liquid phase and is comparable to other cooperative processes of biological systems such as protein folding, DNA helix breaking, or lipid phase transition in a membrane. The thermal properties of water displaying a large heat capacity can explain regulation of temperature in organisms. Consider a daily intake of 2,500 kilocalories ("Calories" in nutrition refer to kilocalories; see definition below). This would cause an increase in body temperature of about 42°C, if the human body were a closed system. Fortunately, the heat of vaporization (sweating) at the surface keeps the body temperature constant. The heat capacity of water itself functions as a buffer if the body is exposed to small changes in body temperature.
Systems with large heat capacity undergo large transitions in intermolecular interactions. Because cooperative mechanism by definition involve the simultaneous transitions of large numbers of molecular interactions, the measurement of the heat capacity of a system in dependence of the temperature can be used to study cooperative processes. Cooperative processes include protein folding/unfolding, DNA helix formation, and phase transitions of phospholipid bilayers. The heat capacity of solutions containing macromolecules like proteins that undergo phase transitions such as unfolding show pronounced peaks in heat capacity instead of a linear increase with temperature for the protein free solution. The figure shows a typical protein unfolding measurement based on the heat capacity of the protein solution. Within a narrow temperature range of between 60 to 70°C the heat capacity of the proteins solution shows a maximum. It can be shown that the native structure of the protein in solution unfolds during this temperature increase form 50 to 70°C. Fig. Heat capacity measurement of protein denaturation The shaded area represents DH of the transition. Since dH = CpdT, the area under the curve is the integral of the differential equation and DH = CpDT (constant pressure). Thus by measuring the heat absorbed by a protein solution while increasing its temperature, we can determine the enthalpy change of the protein unfolding process. The energy is used to break the non covalent interactions that stabilize the native structure of the protein. The small increase in the baseline heat capacity (Cp') represents work of expansion mostly of the buffer solution. Proteins typically have enthalpies of unfolding between 200-600 kJ/mol. Relationship between potential energy and intermolecular forces By understanding the relationship between the potential energy and the forces that hold molecules together in a crystal lattice, we can correlate the heat absorbed during the melting of ice and protein denaturation and the number of hydrogen bond broken during the process. Hydrogen bonds are of course not unique in determining intermolecular interactions. They just happen to be a dominant factor in processes like melting of ice and denaturation of proteins or DNA. Potential energies can be defined for non covalent interactions like ion-ion, ion-dipole, dipole-dipole, ion-induced dipole, and dispersion or Van der Waals forces (see VanHolde Table 2.1 for details which indicates the internal energy E). Dispersion forces refer to interactions between mutually polarizable molecules (induced dipoles only). Potential energy is defined as the energy needed to separate tow particles using the force F over a given distance r.
The force is defined to be negative when the particles attract each other. Moving these two particles further apart thus requires work. The total work required to move the particles from infinite separation to a separation of distance R is called the potential energy, U. Fig. Relationship between force and potential energy of interaction
The potential energy U is at a minimum at distance R0 between the two particles where the force between them is zero (the force is also zero at infinite distance; there the potential energy is by definition zero). In general, every time heat is absorbed by or work performed on biological systems its internal energy changes. This change can either be measured as a change in kinetic energy (K) or potential energy (V) and the internal energy E = K + V. The potential energy can be related to work as derived above. Potential energy equals the work performed when moving to molecules (or particle) away from each other (-Fdr). Similarly, pressure volume work defines the relationship between a force applied to a unit area and the distance this area is moved (= a change in volume; -PdV).
The description of molecular interactions is based on the principles of Newtonian physics. This is molecular mechanics, where molecular motions are determined by the mass and the force acting on atoms (molecules). The nuclei provide the mass and the electrons the force in the relationship F = ma where the force is proportional to the acceleration a of a mass m. The force is related to the potential energy between two atoms (molecules) and defined by the relationship F = - dU/dr. The force applied to an atom therefore is a function on how the potential energy changes as the distance r between interacting atoms changes. We can look at it as the existence of a local gradient of the potential energy and this gradient is known as force field in molecular mechanics. A molecular structure at equilibrium does not experience any net force. When F = 0, the potential energy derivative -dU/dr = 0, which is interpreted as the potential energy being at its minimum. To understand the stability of biological structures at equilibrium, we can simply describe the distribution of non-covalent bonding interactions in the system. These include electrostatic (charges), dipolar (hydrogen bonds), and steric (Van der Waals or dispersion) interactions. It is important to notice that potential energy functions are derived empirically, i.e., they are modeled to fit experimental observation of macroscopic properties. Potential energy function inversely relate to distance r to the power of n, r^n. The different types of interactions relate to different n values (experimentally derived observation). As the distance r increases, functions that depend on higher powers (n>1) of r approach U=0 more rapidly. In other words, these potentials have a lower radius of interaction and are called short-range interactions. Electrostatic interactions have an n=1 relationship (Coulomb's law), dipole-dipole interactions have n=3 relationship, London dispersion forces (the attraction part of Van der Waals forces) have an n=6, and steric repulsion forces (the repulsive portion of Van der Waals forces) have an n=12 relationship and are the most short-range of interactions. The latter represent repulsive forces due to overlap of electron shells (orbitals). Fig. Distance relationship for different molecular interactions
Electrostatic and dipole interactions are also dependent on the dielectric medium of the solvent. The relative difference between curves shown in the figure above may thus be less pronounced. In a high dielectric medium the electrostatic interactions are weakened and no longer dominate. In fact, the dielectric constant of a solvent simply reflects differences in competitiveness of solute-solute vs. solute-solvent and solvent-solvent interaction. Van der Waals interactions are a combination of short-range attractive (London dispersion) forces and short-range repulsive (hard sphere) forces. London dispersion forces originate from short-lived imbalances in electron distribution of an atom generating a temporary dipole. This temporary dipole induces the electron distribution of a adjacent atom to polarize in order to minimize electron-electron repulsion between the two atoms. The magnitude of the attractive interaction depends on the volume and number of polarizable electrons in each atom (molecule). All atoms show induced dipole interactions, but often this short range interaction is negligible in the presence of permanent dipoles or charges. Fig. Van der Waals interactions are a combination of attractive
London dispersion forces and repulsive hard sphere forces. The Van der Waals radius of an atom is defined where the net force between two atoms is zero since the Van der Waals potential is best described as a balance between attraction and repulsion. Hydrocarbons which do not carry any charges and have no permanent dipole are dominated by Van der Waals interactions. These interactions are short-range and thus important in membranes where the phospholipids are tightly packed. The phase transition between a fluid and crystalline state of a bilayer (see below) can be understood as allowing the fatty acid residues to interact through Van der Waals forces. In the liquid phase of a monolayer, the phospholipids are spread too far apart for those interaction to dominate the monolayer stability. Hydrogen bonds allow atoms to interact more closely than allowed by Van der Waals interactions. Hydrogen bonds are a favorable interaction of molecular dipoles of hydrogens bonded with electronegative atoms like oxygen and nitrogen. In general, a hydrogen bond is an interaction between a polarized D-H bond (D is the hydrogen donor) and the polarized nonbonding orbitals of an acceptor (A). Energy attributed to hydrogen bonds varies widely (4 - 48kJ/mol), but
is clearly weaker than a covalent (>200kJ/mol) or electrostatic (60kJ/mol)
bond interaction. An important feature of the hydrogen bond is its conformational
constraint. Electrostatic interactions are directly proportional to the
product of the interacting charges and inversely proportional to the
dielectric constant of the medium D and the distance r separating the
charges. This relationship is defined by Coulomb's law and does not
explicitly account for shielding of the charges from counter ions in
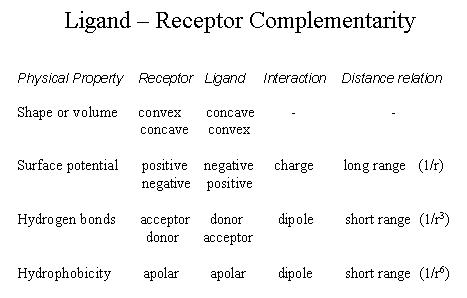
solution (third party ions). Affinity and specificity of binding This microscopid analysis of molecular interactions allows a description of binding at the macroscopic level where interactions are distinguished by strenght (affinity) and selectivity (specificity). A high affinity is a direct result of the presence of atom pairs with low potential energy and how many non-covalent bonds are formed at the binding surface. The distribution of different types of non-covalent bonds (ion pairs, hydrogen bonds, hydrophobic contacts) also determines if two molecules can form an efficiently strong interaction. Thus, there is a geometric dimension involved in binding that relates to the specificity of interaction. The specificity is the result of surface complementarity between an ligand and a receptor:
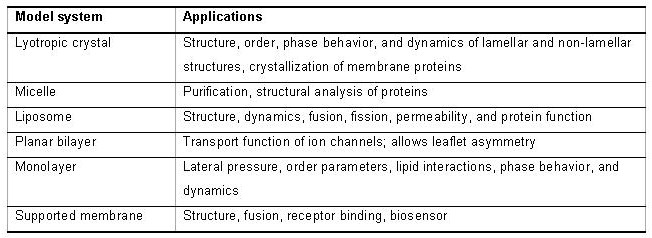
3. Lipid Polymorphism and Self-assembly Lipid structures in aqueous solution A great deal of what we know about the molecular organization of lipid bilayers and the high resolution structure of lipids does not come from membranes of intact cells, but from synthetic systems like liposomal bilayers and hydrated lipids. Hydrated lipid systems form liquid crystalline structures referred to here as lyotropic crystals. Lyotropic crystals and liposomes are model systems that mimic selected aspects of cell membranes. Model systems play an essential role in scientific analyses. In biology, model systems are better known as in vitro systems or reconstituted systems and have contributed important pieces of information to the understanding of the behavior and complexity of cellular structures. The advantage of model systems is that they simplify systems by reducing the number of its components. The ability to simplify a heterogeneous structure like a cell membrane to one, two, maybe three components brings the role of a single component into focus and makes it accessible to experimental testing. This reductionist approach helps:
Model systems are shown in the following table:
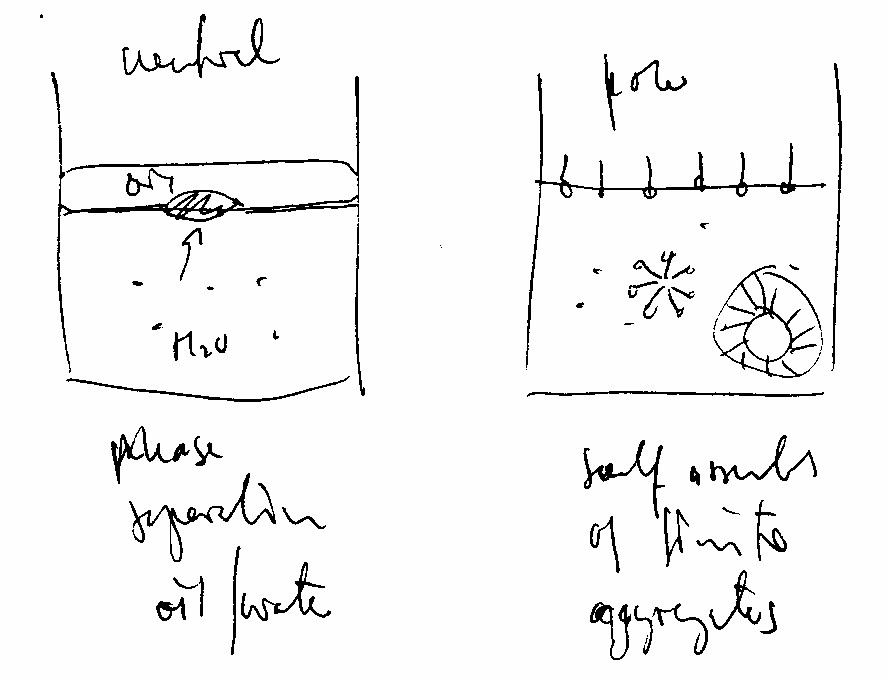
Suspending lipids in aqueous solution does not automatically result in fluid bilayers. As a matter of fact, any lipid can be used to form bilayer and non-bilayer structures at will. To form bilayers requires finding to right choice of temperature, lipid concentration, and other solutes affecting its aggregation behavior. And what might be surprising at first is that conditions for single lipid systems favoring bilayer formation are often different from those found for lipid mixtures and structures (liposomes) mimicking biological membranes. Fig. Neutral lipids completely separate from water, while amphipathic (polar) lipids form soluble aggregates of various forms and internal organization
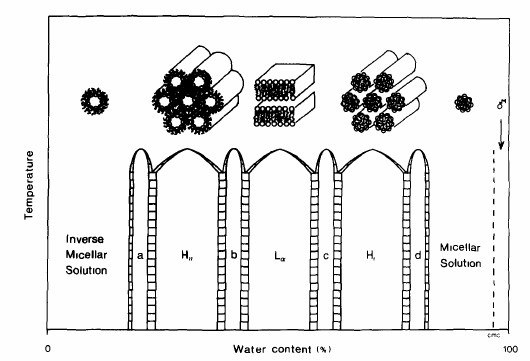
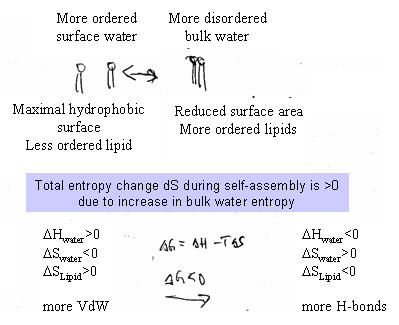
Given the right conditions, lipids self-assemble because clustering reduces the overall Gibbs free energy of the system. This generalized thermodynamic description of self-assembly, however, does not specify what the exact aggregate structure will be, neither with regard to the size and shape of the cluster, nor the internal arrangement of individual molecules. Self-assembly only indicates that the system maximizes the degrees of freedom and the number of polar interactions of its water molecules by forming lipid particles with a water-free hydrophobic core and water-soluble minimal surface. Yet even this depiction is too limited to describe the diversity of possible arrangements, as some water depleted systems orient their lipids with their polar head buried and non-polar chains forming a hydrophobic surface. The shapes of supramolecular structures formed from lipids in aqueous solution fall largely into three types: the spherical micelle, the cylindrical tube and flat and curved bilayers. Which shape is being formed depends on several factors; the chemical structure of lipids and as a result lipid mixtures, the water content and temperature. The chemical structure of the amphiphile itself is affects aggregate structure and is considered an intrinsic factor. The chemical structure includes the a molecule's shape and the relative size and proportion of its polar and non-polar parts, if it is flexible or rigid, charged or uncharged, rod-like or cone-like, short or long, branched or linear, a flat ring or bulky. Because of this relationship between lipid structure and aggregate form, it is not surprising that lipid mixtures behave differently. Since all cell membranes are complex mixtures of dozens of lipids, the relationship between lipid mixture and aggregate behavior is of particular interest to biologists. The supramolecular organization also depends on the amount of lipid, i.e., its concentration in aqueous solution. Instead of lipid concentration, this variable is often expressed as water content. As we will see, this variable is more of experimental than biological significance. Besides the concentration of lipids, the presence of other solutes also affects lipid aggregation. Such solutes include salts, pH, precipitants (non-lipid molecules that trigger lipid aggregation in controlled fashion) and proteins. And finally, aggregation behavior is a function of temperature and pressure, i.e., the physical state of the system. A great deal of knowledge we have about the relationship between the structures of the amphiphile, the structure of the supramolecular complexes they form, and the physical conditions (solvent, temperature) has been obtained from working with hydrated lipid systems. Hydrated lipid systems have a low water content and thus favor the formation of liquid crystalline lipid structures. Crystallization is the result of a separation of lipids from water forming a watery and a lipid enriched phase. This phase separation usually occurs when the water content drops below 40 percent. The lipid enriched phase organizes into tightly packed micellar, tubular or bilayer structures. This packing creates an internal periodicity as is expected from a crystalline organization. The periodicity of repeat units can be limited to one or two dimensions (anisotropic crystals), or extend in all three directions (isotropic crystal lattice). Accordingly, fluid bilayers that stack on top of each other form lamellar crystals. Tubular particles are stacked like cylinders forming hexagonal crystal structures, and micelles form cubic phases reminiscent of the lattice structures in salt crystals. An alternate cubic phase contains curved bilayers with intricate saddle-like minimal surface curvature. Phase diagrams reflect the structural polymorphism of membrane lipids Depending on a combination of various factors any lipid type can be coaxed into adopting any aggregate structure, be that micelles, tubules or bilayers. A systematic probing over a wide range of physical and chemical conditions as to what aggregate structures a lipid can form is referred to as the lipid's phase behavior. The most common binary phase diagrams plot micelle, tubule and bilayer formation as a function of water content and temperature. In these diagrams, each phase is identifiable by its unique internal lipid organization. Consequently, the observation of multiple phases reflects the structural polymorphism of membrane lipids in aqueous solution. The most common phases formed by hydrated membrane lipids include four lamellar (L) phases including a liquid-crystalline L phase as a model for the fluidic lipid bilayer; and a number of non-lamellar phases. Non-lamellar phases include the hexagonal and cubic phases. Hexagonal phases are formed by tubular aggregates and are either normal (HI) or reverse (HII) hexagonal liquid-crystalline phases. Cubic phases are curved bilayers or micelles. Curved bilayer adopt variously curved bilayers with cubic (Q), rhombic (R), and tetragonal (T) space groups. Micelles can form normal (L1; 'oil in water') and reverse (L2; 'water in oil') micelles depending on the water content. Lamellar, cubic and hexagonal phases form at low water content of no more than 30 to 40% weight. At high water content, however, the large supramolecular complexes fragmentize and form regular micelles surrounded by bulk water.
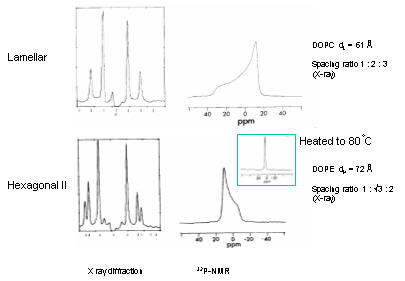
Each phase in a phase diagram has a unique molecular organization and set of properties that distinguishes it from other phases in how lipids are packed and oriented. We say that phases have discernibly different order parameters. Order parameters are determined by X-ray diffraction patterns and chemical shift splitting in spectra derived from nuclear magnetic resonance (NMR) imaging. Lyotropic crystals typically exhibit long range order of their lipids as seen in discrete lattice space patterns of X-ray diffraction studies. Lipid ordering can be restricted to one, two, or three dimensions resulting in lamellar, hexagonal, and cubic phases, respectively. For instance, the lamellar phase has a one dimensional periodicity along the z-axis, i.e., normal to the plane of stacked bilayers (x-y plane). Within the plane of the bilayers, however, no discernable long range or short range order is evident making this phase optically isotropic along the x-y axes. This is of course a reflection of internal ordering and dynamics, where lipid units are free to move within layers (x-y plane), but cannot move from layer to layer (z axis). It is from such observations of lamellar hydrated lipid phases that we think about lipid bilayers as two-dimensional liquids. The phase behavior of lipids can be determined by structural analyses of periodicity. Distinction of phases has come primarily from structural analysis. X-ray diffraction patterns yield distinct space parameters and thus physical dimensions of the crystal lattice in each phase. This is the result of long-range periodicity of regularly packed self-assembly structures such as stacked bilayers (lamellar phase) or stacked micellar tubules of normal or reverse type phase (hexagonal phase). Distinguishing these lamellar and hexagonal phase is based on the observed periodicity of the diffraction peaks, which follow an integral order of 1 : 2 : 3: 4 : … etc. for lamellar phases, while the hexagonal stacking has spacing ratios of 1 : v3 : 2 : v7: … as shown in the next figure.
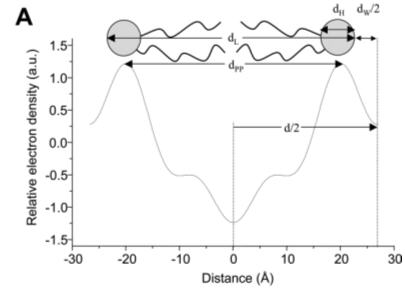
Nuclear magnetic resonance (NMR) spectra using 31P isotope labeled lipids show the typical asymmetric signal intensities for lamellar and hexagonal phases. The lamellar phase produces a line shape with high field peak and low field shoulder. The total chemical shift is about 40ppm (relative to inorganic phosphate). The peak originates from motion averaging about the rotational long-axis of the molecule, while the shoulder indicates anisotropic restriction of head group movements. In a lamellar phase, lipids cannot move along the z-axis (orthogonal to bilayer) and are trapped in a two-dimensional volume. The HII phase shows a reverse asymmetry with a low field peak and narrower high field shoulder. Because of additional averaging of the signal for lipids moving in a circular fashion around the axis of the lipid tubules, the signal is about two fold narrower. Cubic phases are completely isotropic producing a narrow sharp peak in the NMR spectrum (at 80 C). Both X-ray and NMR methods have been successfully used in combination to extract the actual structural information for a specific lyotropic phase. Often, the data is corroborated visually by electron microscopy. Electron microscopy of phospholipid polymorphism model membranes has shown ultrastructural evidence consistent with cubic, reverse hexagonal, and vesicular structures in biological membranes as well as the possible coexistence of non-bilayer structure (particles) within lamellar phases. Calorimetry extends structural analysis of phase diagrams by probing transition states Analysis of phase diagrams is not only interesting for probing the lipid ordering, but also for thermodynamic analysis of phase transition phenomena. One of the most common thermodynamic methods is calorimetry, the measure of heat flowing into or out of a system. Heat flow is related to temperature and expressed as heat capacity, which reflects the amount of heat absorbed for any given increase in temperature of the system. Changes in heat capacity are indicative of changes in molecular interactions within the system. Differential scanning calorimetry (DSC) proves particularly useful to probe phase boundaries by measuring molar enthalpy changes during structural reorganization of lipid complexes. During these rearrangements the simultaneous (cooperative) breaking and forming of a large number of identical non-covalent interactions (e.g. hydrogen bonds, Van der Waals bonds) exhibit sharp, large peaks in the heat capacity curve. Phase boundaries established by calorimetric methods corroborate crystallographic and spectroscopic analyses of phase diagrams. Calorimetric methods measure the heat capacity as a function of temperature under reversible conditions. Heat capacity profiles show peaks of various intensity and width, which can be interpreted as the internal rearrangement of molecular interactions. In biological systems, this usually involves the cooperative breaking and formation of hydrogen bonds. In lipid phases, the majority of non-covalent interactions are hydrophobic bonds (Van der Waals interactions) among hydrocarbon chains. If large numbers of these bonds are broken or formed, and since their potential energies are virtually identical, they will undergo changes (binding or unbinding) at virtually the same conditions showing cooperative rearrangements in crystalline structures. Thus the phase transition from ordered to disordered chain alignment, if cooperative, exhibits a sharp increase in heat capacity of the system over a narrow temperature range. The more uniform the type of conformational change, or type of bond broken, the sharper the phase transition signal. Lamellar phases are used to study the thickness of lipid bilayers Information on bilayer dimensions can be obtained from the lamellar phase behavior of lipid water systems using X-ray, electron, or neutron diffraction data. Fourier transformation provides the reconstruction of electron density profiles. These electron density profiles are intuitive visualizations of the thickness of bilayers and lipid orientation. Electron density of the head group surface and hydrophobic core of cell membranes are easily distinguished from each other as well as the water layer alternating with the bilayers. Thus, these electron density profiles show the distribution of water molecules and depth of penetration of the solvent into the hydrophobic core of cell membranes. An understanding of the distribution of water molecules has come more recently from molecular dynamics simulations of bilayers and calculated electron density maps after running a simulation for several pico seconds.
Average bilayer thickness can be accurately assessed from electron density profiles. As expected the hydrophobic membrane center has a low electron density. The density increases towards both surfaces peaking at the head group region before dropping slightly to the density level of bulk water. The high electron density of head group surfaces come from electron rich oxygens, nitrogen and phosphorus while the low density region of the membrane center is associated to the hydrogen rich terminal methyl groups of the hydrocarbon chains. The average hydrophobic core thickness of bilayers from natural lipids (C16 and C18) is close to 3 nm. The biological relevance of lipid polymorphism It is now generally accepted that cell membranes maintain a lipid blend
that keeps them in the liquid-crystalline (fluidic) phase L but close
to the boundary with the HII reverse hexagonal phase. Keeping the membrane
in a lamellar phase but close to the transition to non-lamellar phases
(curved, micellar) is thought to make membranes susceptible to physiological
signals that can trigger a change in lipid packing, a change one would
expect necessary to induce shape transformations that will lead to fusion
and fission processes. The observation that specific lipids have a propensity to form hexagonal
phases in hydrated systems makes for the interesting proposition that
recruiting lipids to specific sites may play a role in dynamic processes
of fusion and fission of membranes (see section on liposomes). Controlling
the local lipid composition thus not only may affect protein activity
and distribution, but also local curvature, surface tension and ultimately
fission and fusion. Of course, curvature must precede budding and contact
sites leading to fission and fusion, respectively. In lyotropic crystals,
curved bilayers are found in cubic phases representing the stalk structure
of a fusion pores. Hydrophobic effect The driving force of lipid self-assembly into various supramolecular structures is the hydrophobic effect. The simplicity of the concept of the hydrophobic effect is inversely proportional to the difficulty to model it at the molecular level (see Van Holde for details, p.16&137). The stability of the phospholipids within the aggregate is due to both the hydration of the polar head groups and the immersion of the apolar residues into the hydrophobic solvent. The first is an enthalpic gain in solvation due to hydrogen bond formation (potential energy minimization) and the second is a gain in entropy of the bulk water. The hydrophobic effect is only 'valid' at low temperatures (room temperature) and the enthalpic component of solubilization increases with increasing temperature. The entropy model of the hydrophobic effect is derived from an experimental analogy. Here, the transfer of alkanes from organic solvents to water phase at 25 deg Celsius is entropy driven. At 110 deg Celsius the same transfer is mainly enthalpy driven, while the overall dG is about the same. Since biochemical reactions occur mostly around room temperature, it is assumed that the hydrophobic effect, i.e., the segregation of apolar solutes from contact with water molecules also is entropy driven. The hydrogen bond network of water is highly dynamic, therefore the entropy of bulk water is highly entropic. The loss in entropy of water molecules on the surface of hydrophobic solutes is unfavorable, more so than the gain in favorable Van der Waals interactions. The latter are less favorable than the hydrogen bonds water can form with itself. The result is an induced water structure known as clathrate structure. These rigid ice-like cage structures are low in entropy and this is the primary reason that hydrocarbons are insoluble in water. The reduction in surface area is thus considered energetically favorable mostly because of the dramatic increase in favorable water-water hydrogen bonds of bulk water as compared to clathrate structures. Surface monolayers as model system for cell membranes Surface tension Pressure volume work is a form of mechanical work. It may be surprising that mechanical work is important in biological systems, but pressure-volume work is critical for osmotic effects. Osmosis is important for regulation of water flow, ion transport and cell volume in all organisms. While the type of work of interest in biochemistry is mostly of electrical and chemical nature, there is a type of mechanical work of interest to biochemists; the work occurring at interfaces like membranes and protein surfaces. The physics of interfaces deals with the intermolecular forces across phase boundaries and are essentially two dimensional systems. The best studied surface system and the most relevant to understand physical properties of biological membranes is the air-water interface. It takes work to distort the surface of an object without adding or removing molecules. Such a distortion can simply mean a change in surface area, dA. (Note: if the change in surface are is accomplished by adding/removing molecules, then the work is equal to the change in chemical potential m)
The parameter g is called the surface tension and represents the force/unit distance [N/m] or energy/unit area [J/m2] a molecule experiences at the air-water interface:
At the air-water interface, a water molecule experiences a strong attraction to other water molecules due to hydrogen bonding (F'), but a very weak attraction towards the air (F), which is essentially a low dielectric medium. The spontaneous loss of water molecules to the air phase is small, but not zero. At constant temperature and pressure, dW is dG, the Gibbs free energy
change on increasing the area of an interface. Some values for g of different interfaces are given in the table below
and are measured in mN/m.
Monolayers Surface active molecules have a tendency to accumulate at the air-water interface and change its surface tension. The reason for this behavior lies in the amphipathic nature of these molecules. Fig. Spacefilling models of detergent (left) and phospholipid
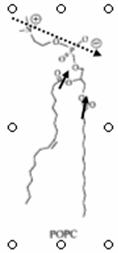
Phospholipids are a good example. When carefully placed on the surface of water in a beaker, phospholipids will spontaneously form a monolayer at the air water interface, with the hydrophilic head groups solubilized in the aqueous phase and the hydrophobic fatty acid tails oriented toward the air. Fig.
Phospholipid monolayer at air-water interface Measurement of surface tension One preferred technique to measure the surface tension of of the water
surface is the ring method. The principle involved states that the force
required to detach an object from a the water surface Surface pressure Experimental device to measure change in surface tension in dependence of available surface area has been developed by Langmuir and Adam and is represented in the figure below:
Water is placed in a rectangular Teflon trough filled to the brim. The water level is above the brim, but does not spill. Two hydrophobic (Teflon) barriers lie across the trough, one fixed, the other mobile. A drop of hexane/lipid solution is put in-between the barriers onto the water surface. A phospholipid monolayer will form while within seconds as the volatile hexane solvent evaporates. The area of the monolayer can be decreased by moving the left barrier. Since the monolayer surface has a lower surface tension than the clean water surface, each barrier will experience a force in the direction of the clean surface. In other words, the monolayer is exerting a pressure on the barriers that confine it. This is called the surface pressure p and is simply the difference between the surface tensions of the clean surface (g0) minus the monolayer surface (g). p = g0 - g When both the amount of material in the monolayer and the area it covers are known, the experiment gives values of p as a function of the area per molecule in the monolayer.
The above figure shows an example of surface pressure - area (Langmuir) isotherms of stearic acid as a function of the pH of the bulk solution. The Langmuir isotherm was developed by Irving Langmuir in 1916 to describe the dependence of the surface coverage of an adsorbed gas on the pressure of the gas above the surface at a fixed temperature. Along a particular isotherms the system is always at equilibrium. Consequently, Langmuir isotherms are fully reversible and obviously the equilibrium pathway differs at different proton concentrations. At pH=1 (open circle) a solid monolayer is formed by stearic acid which appears homogeneous right to the point where it is compressed the most (about 25 molecules/A2). Molecular interpretation of surface pressure-area isotherms Monolayers exist in a variety of states depending on the surface pressure, area per molecule, temperature, ionic strength of solution etc.. The various states of monolayers are solid condensed (S), liquid condensed (L2), liquid expanded (L1), and intermediate liquid (I), and gas (G). Fig. States of monolayers in p-A isotherms
The type of a monolayer formed (with characteristic p-A isotherms) by different lipids will depend on the intermolecular
forces between the molecules at the surface. *gaseous state: there is little interaction between the apolar residues, but the attraction of the polar headgroups to the water phase and the apolar residues to the air is sufficient to anchor the amphipathic molecules at the surface; long fatty acid chains may actually lie flat on the water surface
Monolayer states of phospholipids Phospholipids are complex molecules and vary both in their fatty acid and head group composition. Here is a list of observations of general interest to the biophysics of membranes as obtained from pressure-area isotherms. - comparing lecithin from different sources shows that an increase in unsaturation (oxidation) of the fatty acids correlates with more expanded monolayers. In other words, the limiting area per molecule for phospholipids containing unsaturated fatty acids is larger than that for lipids with saturated fatty acids. - similarly, the longer the fatty acids the smaller the area per molecule; this might be explained by an increase in (attractive) dispersion forces between the long apolar side chains as compared to the shorter fatty acids The temperature has a great affect on the surface pressure behavior of phospholipid monolayers. The lower the temperature, the smaller the limiting area per molecule. This means that low temperature induce solid compressed or crystalline phases. Fig. Pressure-area isotherm for phospholipids at various temperatures
The figure shows the temperature dependence of dipalmitoyl phosphatidylcholine (DPPC) packing. The C16 fatty acids are saturated and the limiting area per molecule is smaller than that of phospholipids from biological membranes. Open squares show the isotherm at 6°C, filled circles the isotherm at 35°C. At 21°C (x) a marked shift in the isotherm profile is apparent with the monolayer going through liquid phases. This temperature range indicates the transition temperature found in membranes made of DPPC which denotes the transition from a crystalline to a fluid (liquid) state of the bilayer. The measurement of temperature dependence of monolayer isotherms thus is predictive of the physical state of bilayers. Effects of headgroup structure on monolayer behavior As the figure on stearic acid isotherms shows, pH and ionic strength affect the phase behavior of monolayers during compression-decompression experiments. This is an effect of mobile ions interacting with the fixed charge on the headgroup of the surfactant. The carboxylic group of stearic acid changes its protonation state in dependence of the pH of solution (pK = 2; means no charge at pH=1, negative charge at pH = 3 or higher, including physiological pH). p-A isotherms, however, do not distinguish the effects of interaction of polar and apolar portions of the amphipathic surfactants. To isolate the influence of headgroup effects on the phase behavior of monolayers, surface potential measurements are used. The surface potentials of some phospholipids of biological membranes as a function of pH are shown in the figure below: Fig. pH dependence of surface potential of phospholipids At a pH less than 3.5 all phospholipids induce an increase in surface potential which had been attributed to the protonation of the primary phosphate and a resulting increase in molecular dipole moment. For PE (and less so for PS) the decrease in surface potential above pH 9 has been correlated to the deprotonation of the primary amino group. PA shows a deprotonation of the second hydrogen of the phosphate group. Similarly, the ionization of the carboxyl group on the PS induces a large decrease in surface potential between pH 2 and 5.5. The surface potential of a monolayer
is a property dependent on the nature of the polar headgroups in the
interface. The surface potential is mainly determined by three components
of a phospholipid headgroup: - the molecular dipole of the head group
Based on the flexibility and orientation of these various components, the interpretation of surface potential measurement is difficult. It has been suggested, that the zwitter ionic structure does often not contribute much because it is oriented parallel to the air water interface. The role of Ca++ The interaction of cations with phospholipid monolayers is of interest particularly for calcium because this divalent cation plays a special role for biological membranes. The effects of calcium can be measured by either p-A or DV-area isotherms. The latter, however, will be more difficult to interpret because the presence of the calcium charges and corresponding counter charges (chloride) in bulk solution (ionic double layer). Surface pressure-area isotherms then are most useful in studying the effect on the fluidity of monolayers (bilayers) in the presence of calcium. In general, calcium induces more crystalline like phase behavior due to its ability to chelate negatively charged phospholipid head groups. PS, PA, and PI containing monolayers are more sensitive to the presence of calcium than monolayers composed of neutrally charged lipids. The unsaturation of the fatty acid residues also influences calcium binding because higher content of oxidized fatty acids in phospholipids induces larger area/molecule values and thus increases the space between head group charges. |
 The optimal alignment of the three atoms D-H...A
is a head to tail linear arrangement. Similar to Van der Waals interactions,
the hydrogen bond at equilibrium is described by the balance of an attractive
and repulsive potential of a 6-12 type. In the definition of V(HB) the
constants C and D are specific for each donor-acceptor pair. The relationship
of this potential, however, is only exact in the absence of any solvent
effect. Water molecules are able to compete with hydrogen bonds formed
in biological macromolecules and it is not easy to predict, if hydrogen
bonds stabilize or destabilize intramolecular interactions. In general,
it can be assumed that a low dielectric medium (e.g. the absence of
water; inside a membrane or protein fold) hydrogen bonds are stabilized
and described by the potential V(HB). For phospholipid bilayers, hydrogen
bonds are important in stabilizing and anchoring the polar head groups
in the water phase.
The optimal alignment of the three atoms D-H...A
is a head to tail linear arrangement. Similar to Van der Waals interactions,
the hydrogen bond at equilibrium is described by the balance of an attractive
and repulsive potential of a 6-12 type. In the definition of V(HB) the
constants C and D are specific for each donor-acceptor pair. The relationship
of this potential, however, is only exact in the absence of any solvent
effect. Water molecules are able to compete with hydrogen bonds formed
in biological macromolecules and it is not easy to predict, if hydrogen
bonds stabilize or destabilize intramolecular interactions. In general,
it can be assumed that a low dielectric medium (e.g. the absence of
water; inside a membrane or protein fold) hydrogen bonds are stabilized
and described by the potential V(HB). For phospholipid bilayers, hydrogen
bonds are important in stabilizing and anchoring the polar head groups
in the water phase.
 The most important aspect of Coulomb's law for biological
systems is the effect of the dielectric constant D on electrostatic
interactions. The dielectric constant defines the effect of the solvent
on molecular structures and as such is a macroscopic property. In biological
systmes, membranes (with low D) and aqueous compartments (with high
D) explains the solubility of ions in water, and the electrical insulation
of membranes, i.e., they are impenetrable for ions unless an ion channel
provides an adequate pathway. Since the dielectric constant is a macroscopic
property it is difficult to apply it to systems of very small volume,
i.e., very small numbers of molecular interactions.
The most important aspect of Coulomb's law for biological
systems is the effect of the dielectric constant D on electrostatic
interactions. The dielectric constant defines the effect of the solvent
on molecular structures and as such is a macroscopic property. In biological
systmes, membranes (with low D) and aqueous compartments (with high
D) explains the solubility of ions in water, and the electrical insulation
of membranes, i.e., they are impenetrable for ions unless an ion channel
provides an adequate pathway. Since the dielectric constant is a macroscopic
property it is difficult to apply it to systems of very small volume,
i.e., very small numbers of molecular interactions.
 is given by the surface tension g
multiplied by the perimeter of contact between the object and the surface
at the point of detachment. In the ring method, a platinum wire is suspended
in water and the force which is required to just detach it from the
surface is measured. At detachment the measured force F = mg + 4pRg, with m the mass of ring with radius R. Alternatively, a
small paper hanging from a microbalance is immersed in water and the
force by which the paper is pulled into the water is measured. In monolayer
experiments, the addition of lipids or the compression of a given amount
of lipids when decreasing the surface area decreases the surface tension.
is given by the surface tension g
multiplied by the perimeter of contact between the object and the surface
at the point of detachment. In the ring method, a platinum wire is suspended
in water and the force which is required to just detach it from the
surface is measured. At detachment the measured force F = mg + 4pRg, with m the mass of ring with radius R. Alternatively, a
small paper hanging from a microbalance is immersed in water and the
force by which the paper is pulled into the water is measured. In monolayer
experiments, the addition of lipids or the compression of a given amount
of lipids when decreasing the surface area decreases the surface tension.